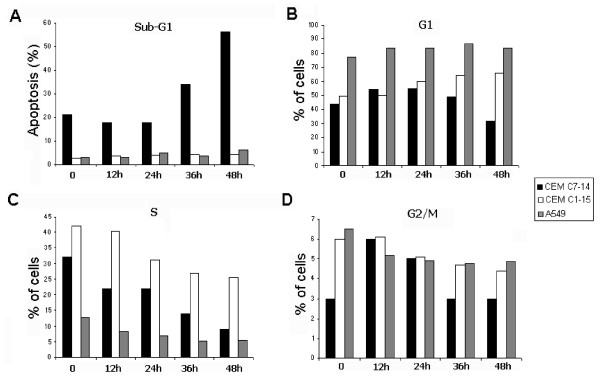
Figure 7.
CEM-C7-14 cells accumulate in Sub-G1 phase after prolonged hormone treatment. CEM-C1-15, CEM-C7-14 and A549 cells (white, black and grey bars respectively) cultured in DCC-treated media incubated with Dex (1 μM) for the times indicated and FACS analysis performed as described previously [53]. Sub-G1 (A), G1 (B), S (C) and G2 (D) cell cycle phase profiles are representative of three independent experiments.

