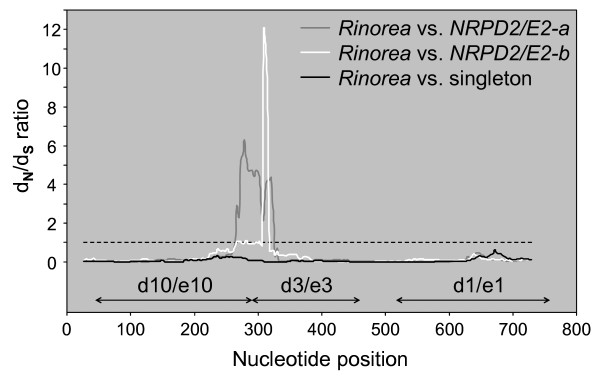
Figure 4.
Sliding window plot of dN/dS ratios for NRPD2/E2 in Violaceae. The plot was generated by comparing the Rinorea sequence to singleton NRPD2/E2 in Cubelium, Hybanthus and Corynostylis (black), to NRPD2/E2-a in Allexis and Viola (gray), and to (3) NRPD2/E2-b in Viola (white). Window length was set to 54 bases and step size to 9 bases. Sites interacting with the other Pol IV/V subunits Nrpd1/Nrpe1 (d1/e1), Nrpd3/Nrpe3 (d3/e3) and Nrpd10/Nrpe10 (d10/e10) are shown, based on findings for Pol II [2]. Sites under neutral (dN/dS = 1) or positive selection (dN/dS > 1) are seen in a restricted 54 bp region, from position 249 through 302, for NRPD2/E2-a and NRPD2/E2-b while purifying selection (dN/dS < 1) predominates in the rest of the locus. Corynostylis arborea and B_Allexis batangae were excluded from the sliding window analysis because of a lack of data from exon 7.

