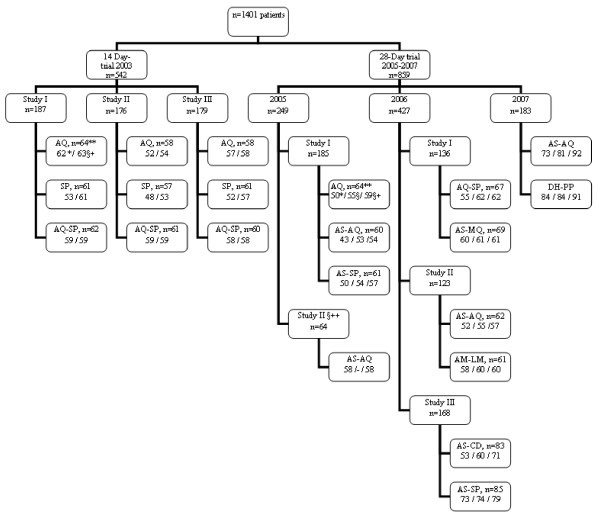
Figure 1.
CONSORT flow diagram. ** The number of includedpatient in the corresponding treatment group. *The number of observedACPR without PCR correction. § The number of ACPR corrected by PCR. §+: The total number of patient followed (number of observed ACPR + number of failures). The number of patient either lost to follow-up or excluded is obtained by subtracting §+ from **. §++ a non randomized study of AS-AQ.

