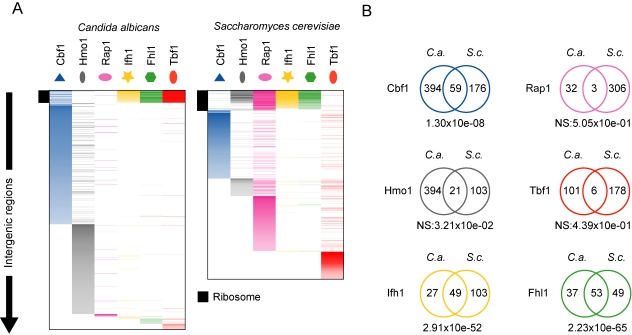
Figure 2. Evolution of the genome coverage of transcription factors involved in the RP transcriptional regulatory network.
(A) Visual display of TF binding sites in the genomes of S. cerevisiae and C. albicans. Color saturation follows the log2 fold enrichment values in ChIP-chip experiments. Intergenic regions were first sorted by function (ribosome, sulfur starvation/amino acid biosynthesis, and glycolysis) and then by fold change for each regulatory protein. (B) Overlaps between the sets of targets of orthologous TFs of C. albicans and S. cerevisiae. The p values of each overlap were calculated using a hypergeometric distribution and is shown beneath each Venn diagram. NS stands for non-significant overlap.

