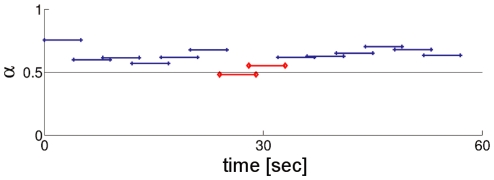
Figure 4. DFA results per block for a representative trial.
The x-component of the lines stands for the time coordinates of the analyzed block and the y-component is the scaling coefficient obtained for that particular block. The red lines in the middle are the ones that cover the perturbation section of the trial.

