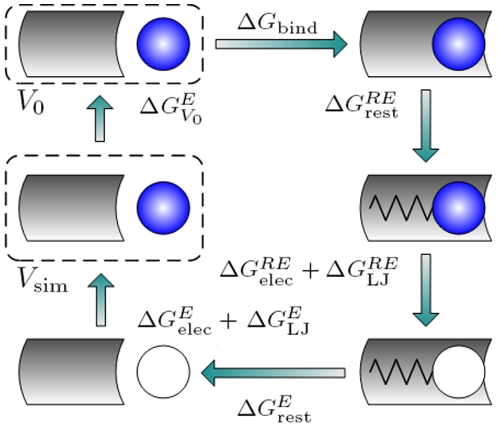
Figure 3. Thermodynamic cycle used for calculating binding affinities.
Since the free energy is a state function, the calculation of binding affinity is decomposed into several steps [34]. Eqn 1 was used to calculate the binding affinity  between the ERs and E2. The gray curved rectangle represents the receptor, the blue circle represents E2 with all interactions turned on, and the white circle indicates that all interactions are turned off. The spring represents the restraints between E2 and receptors.

