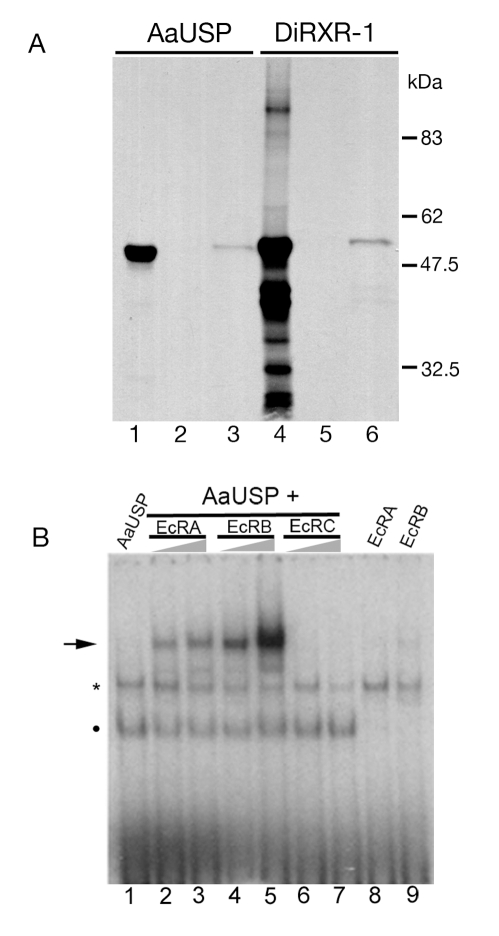
Figure 4. Bma-EcR heterodimerization with USP and DNA binding.
(A)GST or GST:Bma-EcR fusion protein immobilized on glutathione agarose beads was incubated with 35S-labeled in vitro translated mosquito USP (AaUSP) or D. immitis Di-RXR-1 as indicated. After washing, the bound protein was detected by SDS-PAGE and autoradiography. Lanes 1 and 4 correspond to AaUSP and Di-RXR-1, respectively, which were used as the input in this assay. Lanes 2 and 5 correspond to beads coated with GST alone, exposed to AaUSP or Di-RXR-1, respectively. Lanes 3 and 6 correspond to AaUSP and Di-RXR-1, respectively, bound to GST:Bma-EcR. (B) Gel-shift analysis of Bma-EcR-A, putative -B, and -C isoforms, combined with AaUSP on a palindromic EcRE. Bma-EcR-A and -C heterodimerize with USP and bind the EcRE. Increasing amounts of each Bma-EcR isoform (as indicated above the triangles) were incubated with AaUSP and the DNA probe as indicated. A specific band is observed when Bma-EcR-A or -B is combined with AaUSP (arrow). Bma-EcRC shows no binding. A band corresponding to AaUSP alone is indicated by a dot. No binding was observed in the absence of AaUSP with either isoform. A non specific band from the rabbit reticulocyte lysate (asterisk) is present in all lanes. Lane 1: only USP. Lanes 2, 4 and 6: USP with 1 µL EcR. Lanes 3, 5, and 7: USP with 2 µL EcR. Lanes 8, 9 only the corresponding EcR. The higher intensity of the EcRB band is likely the result of higher concentration of this protein (see Fig. S3).

