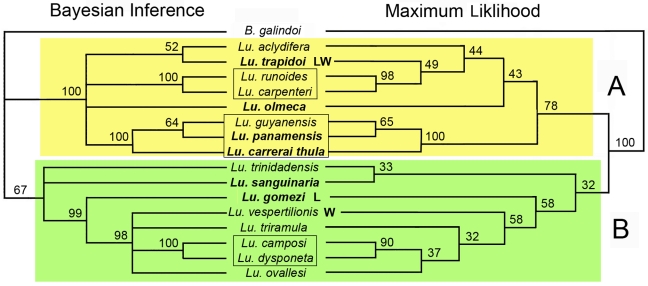
Figure 3. Bayesian Probability and Maximum Likelihood trees based on 500 bp of the 18s gene sequenced from 17 Phlebotominae species.
The topologies produced by these approaches identify two deep clades each containing the same set of species. Man-biting species are in bold type. Infection status for Lutzomyia and Wolbachia are indicated by “L” and “W”.

