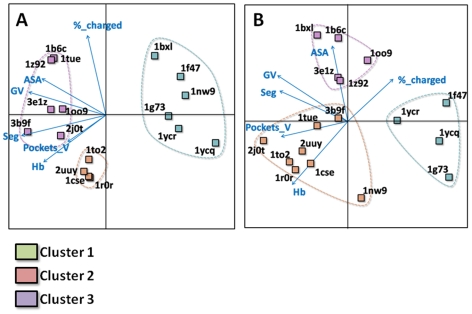
Figure 4. PCA analysis.
Six key parameters were selected to perform the PCA analysis to separate the complexes into different groups: The five parameters based on the t-test and defined in figure 3 as well as total pocket volume at the interface. A: Analysis on the whole interface. Three different PPI clusters were defined. Cluster 1 (green) regrouped all complexes from class I corresponding to targets interacting with a peptide. Subtilisin and trypsin complexes defined cluster 2 (pink). Cluster 3 (purple) regrouped all other protein/protein complexes. B: Same analysis done on the part of the interface that is 4.5 Å around the ligand. The protein/protein complexes were in three slightly different clusters. Four out of six class I complexes were grouped together. Subtilisin and trypsin complexes remained very closely associated.

