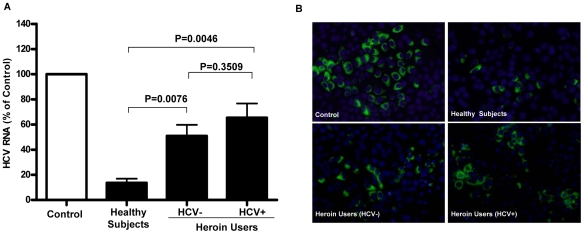
Figure 4. Comparison of anti-HCV activity of CD56+ T cells among three study groups.
HCV JFH-1-infected Huh 7 cells (day 3 post infection) were cultured for 48h in the presence or absence of pooled SN from IL-12-stimulated CD56+ T cells from the healthy subjects and the heroin users with or without HCV infection as indicated. (A) Real-time RT-PCR analysis of HCV RNA. Total cellular RNA extracted from Huh7 cells treated with or without pooled SN of CD56+ T cells from three study groups as indicated was analyzed by the real-time RT-PCR for HCV and GAPDH RNA quantification. The data are expressed as HCV RNA levels relative (%) to control (without SN treatment, which is defined as 100). The results are mean ±SD of triplicate cultures, representative of three repeated experiments using pooled CD56+ T SN from three study groups. Statistical significance was performed using student t-test. (B) Immunofluoresence analysis of HCV NS3 protein expression in Huh 7 cells. HCV NS3 protein expression in Huh7 cells treated with or without pooled CD56+ T SN from three study groups as indicated was determined by immunofluoresence staining with antibody against HCV NS3 (green). The nuclei were stained with Hoechst 33258 (blue). One representative result of 3 experiments is shown (200×).

