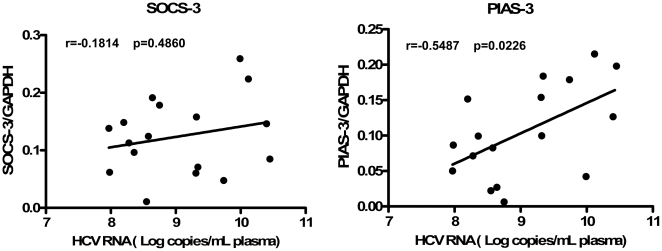
Figure 8. The relationship between plasma HCV viral loads and the levels of SOCS-3 and PIAS-3 in CD56+ T cells.
Spearman correlation (r and p-value) was calculated to determine the relationship between the levels of SOCS-3/PIAS-3 in CD56+ T cells and the levels of HCV RNA in plasma from the heroin users infected with HCV (n = 17). The levels of PIAS-3 in CD56+ T cells were positively correlated with those of plasma HCV RNA (P<0.01).

