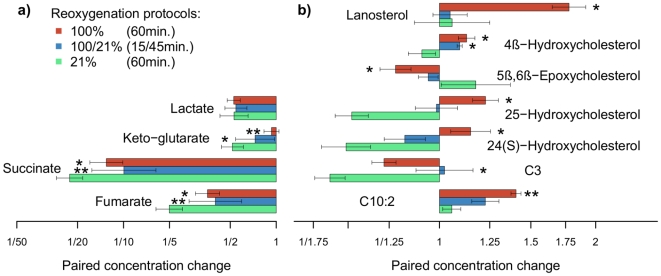
Figure 5. Concentration ratios of metabolites due to resuscitation protocols.
An explicit summary of concentration ratios for the set of metabolites found significant at a q value<0.01 due to resuscitation protocols (n = 8–11). Bars correspond to the paired changes during reoxygenation (to the left–decline; to the right–increase). Bars in: green: resuscitation with 21%O2; blue: 100% O2 for 15 min and 45 min of 21% O2; and red: prolonged hyperoxia, 100% for 60 minutes. Levels of significance are coded as follows: *, q<10−2, **, q<10−4.

