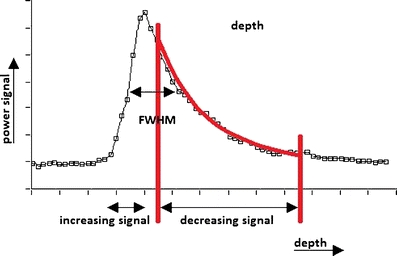
Fig. 1.

A typical deconvoluted OCT signal versus depth of a layer deposited on a fibre tip. The vertical axis is the amplitude signal and the horizontal axis is the depth. The red lines indicate the region of interest of the fit to Eq. 1. The maximum layer thickness, d max, was determined from the full-width at half-maximum (FWHM). The distance between the pixels (white squares) is 4.3 µm, based on a layer of assumed refractive index of 1.5
