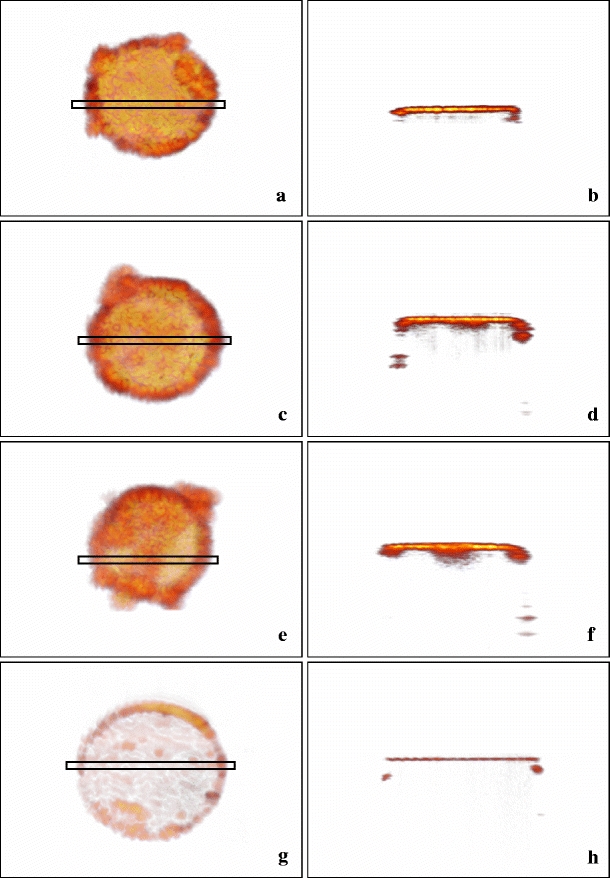
Fig. 4.

Three-dimensional OCT scans of clinical fibres: left column top views, right column cross sections (location indicated by the rectangles in the left images). a, b Fibre 3 used at 810 nm. c, d Fibre 6 used at 940 nm. e, f Fibre 13 used at 1,470 nm. g, h Unused fibre. The thickness (h) equals the OCT resolution of about 11 μm. The darker areas (left), corresponding with the deeper parts of the layers (right) are likely holes (as in Fig. 5), here filled with carbonized blood. These holes are the sites where d max was measured
