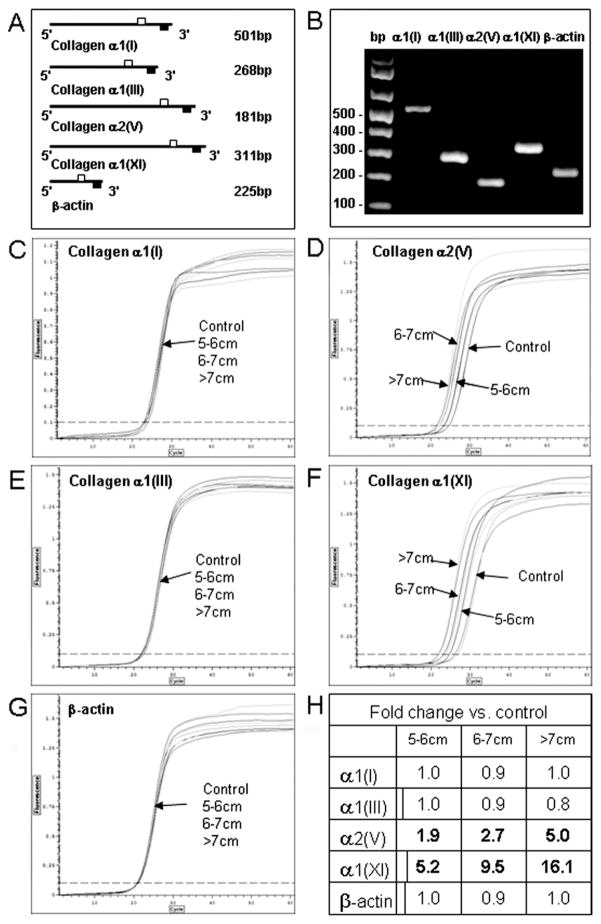
Fig 3.
Quantitative reverse transcription-polymerase chain reaction (qRT-PCR). Panel A shows primer sets used for qRT-PCR and expected product size (open squares = forward primer; closed squares = reverse primer). Panel B shows a representative 1.5% agarose gel of amplified products from each primer set. Panels C to G show real-time quantitative amplification curves for collagen α1(I), α1(III), α2(V), α1(XI), and β-actin. For C–G, x-axis = cycle; y-axis = fluorescence. In C, measurements are 0–60 fluorescence units at increments of 10 along x-axis and 0–1.2 fluorescence units at increments of 0.1 along y-axis; in D–G, measurements are 0–60 fluorescence units at increments of 10 along x-axis and 0–1.5 fluorescence units at increments of 0.25 along y-axis. Ascending thoracic aortic aneurysm size is indicated. Panel H shows the fold changes versus controls. Significant differences versus control at p less than 0.001 are shown in bold type.

