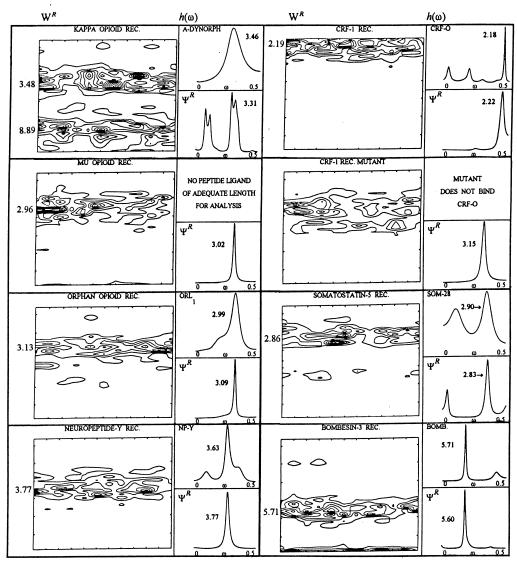
Figure 3.
Summaries of the graphs of the discrete wavelet transforms WR of each ΨR (Left of each panel), the maximum entropy, complex poles power spectra h(ω) values of each peptide ligand (Upper Right of each panel), and the h(ω) of its receptor ΨR (Lower Right of each panel) for a representative set of peptide ligands and their G protein-coupled, transmembrane receptor sequences. The sequence lengths along the abscissa of the WR plots (receptor length in amino acid residues minus the lag of the autocovariance matrix) are as follows: KAPPA OPIOID RECEPTOR (REC). = 362, MU OPIOID REC. = 402, ORPHAN OPIOID REC. = 352, NEUROPEPTIDE-Y REC. = 368; CRF-1 REC. = 307, CRF-1 REC. MUTANT = 307, SOMATOSTATIN-5 REC. = 373, and BOMBESIN-3 REC. = 486. See text for details of each peptide-receptor match and the relevant experiments in chimeric exchanges and point mutations. Note particularly the top two panels on the right that associate the loss of the peptide ligand-matched dominant hydrophobic free energy receptor mode in a nonbinding mutant receptor for ovine corticotropin releasing factor.

