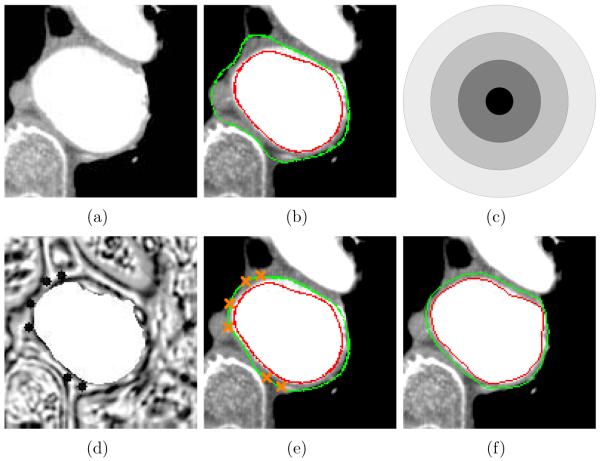
Figure 6.
Effect of control points. (a) Original CTA image. (b) Thrombus segmentation result without any control point. Luminal and thrombotic surfaces are in red and green, respectively. (c) The shape of the region modified by inserting a control point. It is scaled up to describe the modified region. (d) Cost function image for the thrombotic surface modified by 6 control points. (e) Thrombus segmentation result with 6 control points. (f) Independent standard.

