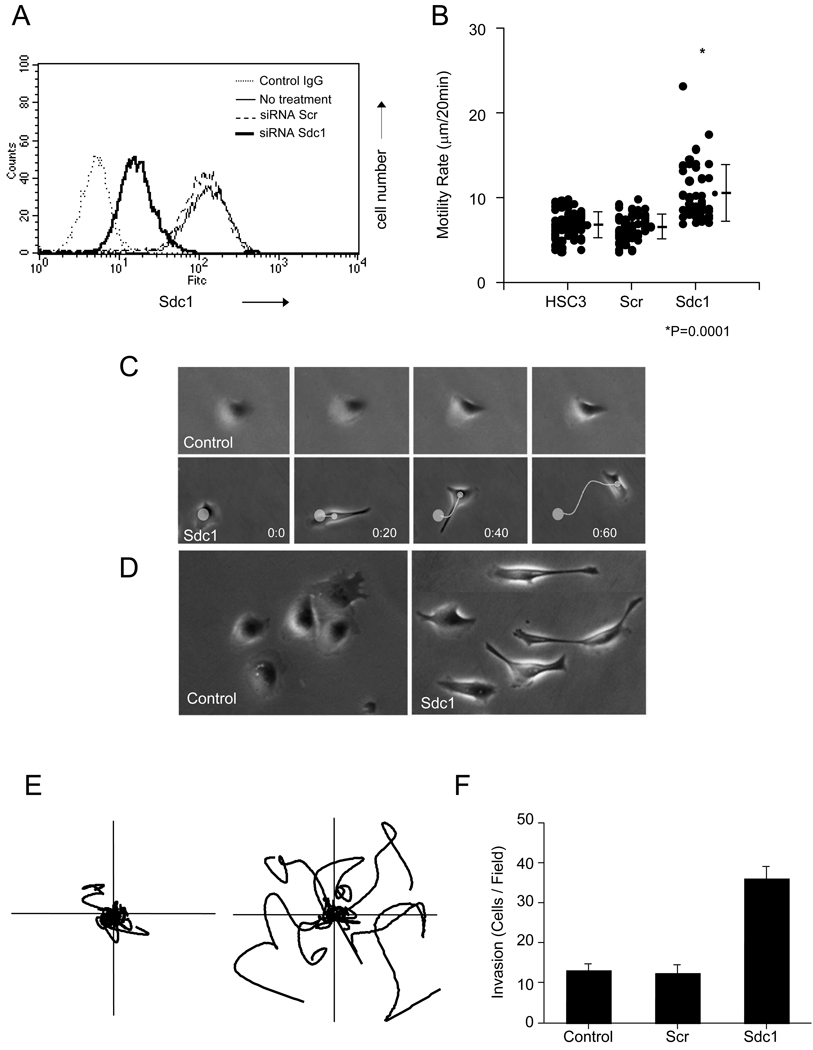
Figure 3.
Silencing of Sdc1 expression by siRNA targeting. (A) HSC3 cells were transfected with Sdc1 siRNA or with non-targeting siRNA. After 24 h, Sdc1 expression was analyzed using FACS as described in “Material and Methods”. (B) HSC-3 cells were transfected with non-targeting siRNA and Sdc1 siRNA. HSC-3 and transfected cells were plated on Type I collagen-coated substrates (1 µg/ml) and assessed for cell motility using time-lapse microscopy for 3 h. Motility rates were analyzed as described under Material and Methods. Data represents the motility rate of individual cells along with the mean and S.D. (C) Cell locomotion and morphology on Type I collagen substrate was followed by time-lapse phase-contrast microscopy (20 min intervals). Control HSC3 cells (top panel) display little migration over time, whereas cells transfected with Sdc1 siRNA (lower panel) rapidly migrated with an elongated fibroblastic morphology. (D) Morphology of control HSC3 cells or Sdc1 siRNA-transfected cells on 1 µg/ml collagen following incubation on the substrate for 2 h. (E) HSC3 cells (left) and cells transfected with Sdc1 siRNA (right) were assessed for cell motility using time-lapse microscope on 1 µg/ml collagen I for 3 h. Individual representative cell tracks are shown. (F) Effect of suppression of Sdc1 expression on cell invasion. Control and siRNA-transfected HSC-3 cells were seeded onto collagen I gels. Invasion was assessed as detailed in Materials and Methods; data represents the mean and S.D. Experiments were repeated three times with similar results.

