
Figure 9.
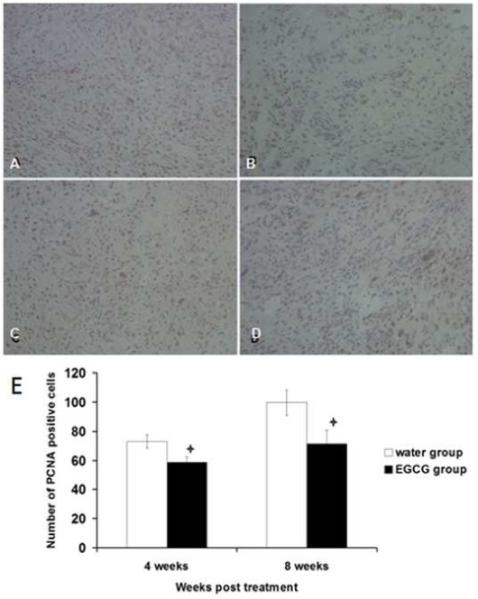
Effect of EGCG on PCNA expression by ELT3 Cells in vivo detected using immuno-histochemical staining. Representative fields from each group, at 4 and 8 weeks post-treatment. (A) water-fed control after 4 weeks, (B) EGCG treated after 4 weeks, (C) water-fed control for 8weeks, (D) EGCG treated for 8 weeks. Positive cells were brown. Magnification 200×. E) Effect of EGCG on PCNA expression by ELT3 cells in vivo at 4 and 8 weeks post-treatment. The positive cells were counted from 4 fields per each slide randomly. Asterisk indicate significance (P<0.05) compared with control.