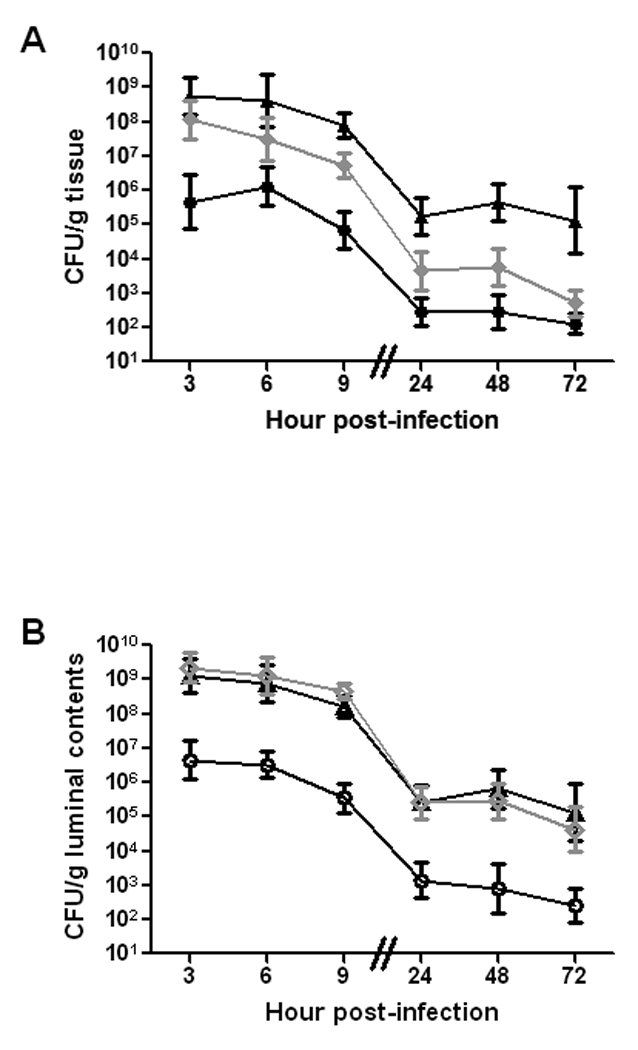
Fig. 2.

Levels of E. coli O157:H7 over time at different sites in the gastrointestinal tract of BALB/c mice orally-infected with 6–8 × 10⁸ CFU of strain 86-24NalR. The GM CFU/g tissue (A) or luminal contents (B) from groups of 8–17 mice each are shown for the small intestine (●), cecum (▲), and large intestine ( ) as well as the luminal contents of the small intestine (○), cecum (Δ), and large intestine (
 ). Bars indicate the 95% confidence interval.
