Fig. 3.

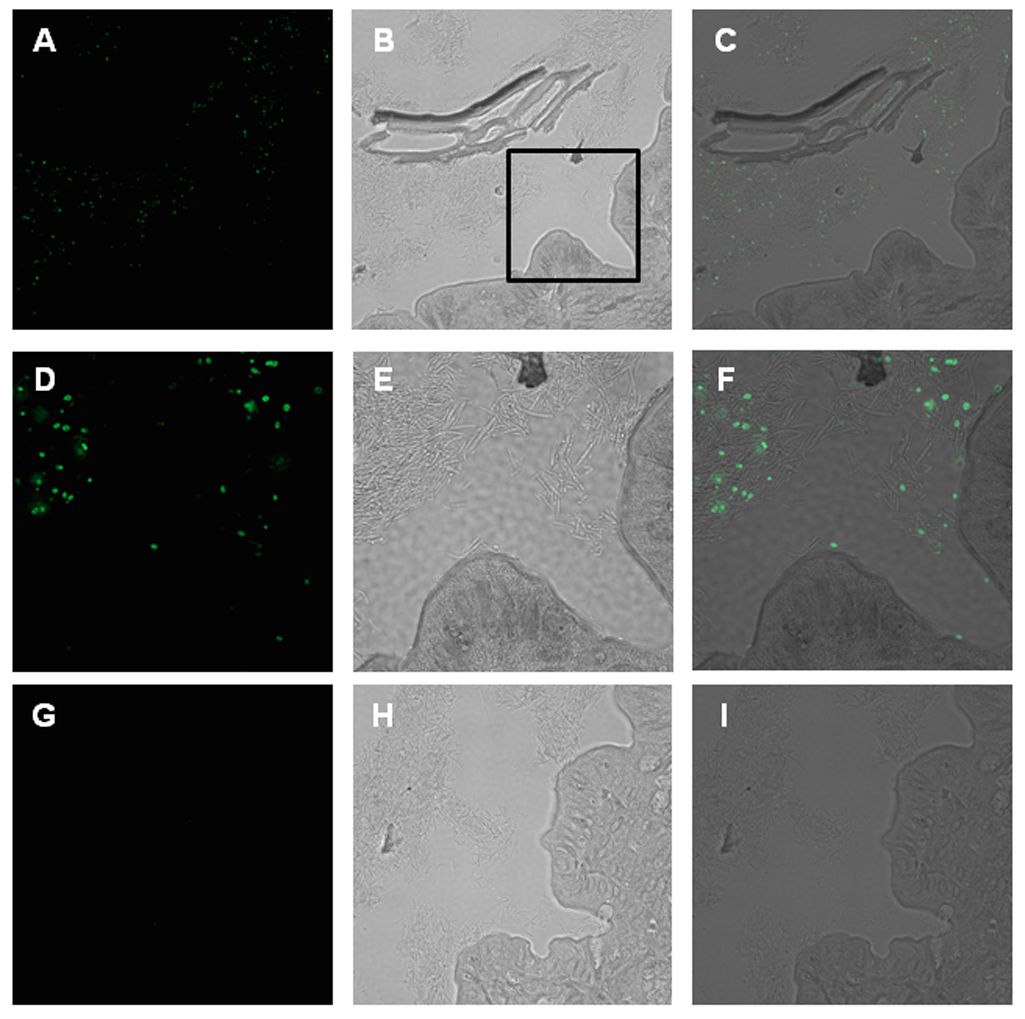
Immunofluorescent E. coli O157:H7 in the cecum. Mice were infected with E. coli O157:H7 (A–F) or mock-infected (G–I) for 6 hours. Images display infected or control ceca stained for O157 (A, D, and G), the phase contrast image of the cecal section (B, E, and H), and the merged images (C, F, I). Panels D, E, and F are a higher magnification of the boxed area of panel B. For panels A–C and panels G–I the original image was obtained at a magnification of 40×. For panels D–F the original image was obtained at a magnification of 100×.
