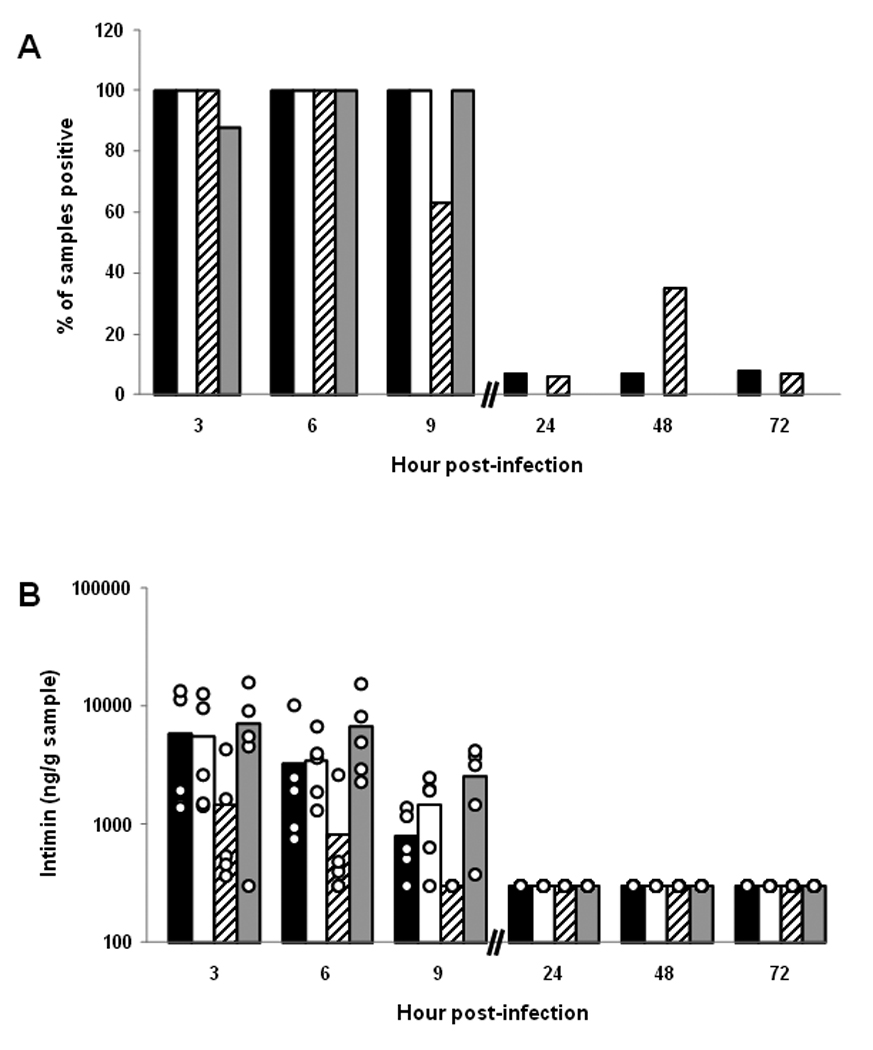
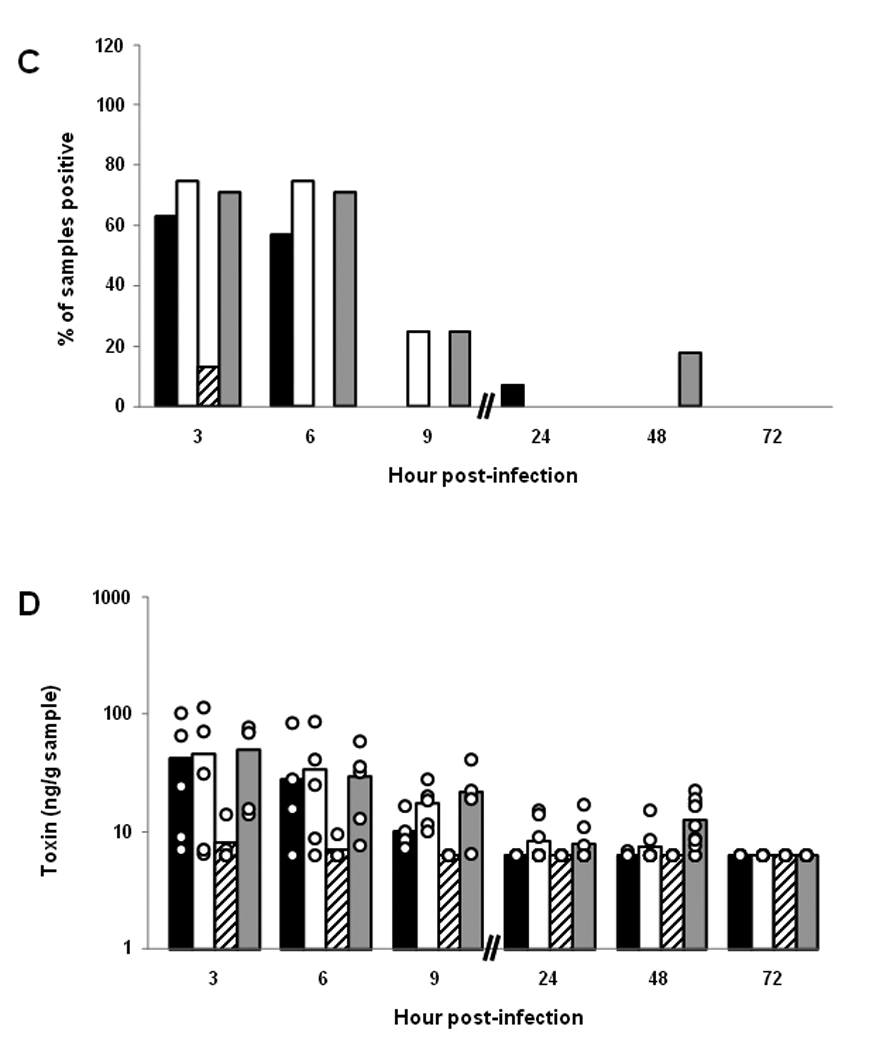
Fig. 4.


Presence of intimin and Stx2 over time at different sites in the gastrointestinal tracts of BALB/c mice orally infected with E. coli O157:H7 strain 86-24NalR. (A) Percent of different intestinal samples positive for intimin over time. Each bar represents the mean of 8–17 samples tested. For panels A–D, the tissues are represented by black bars (cecum), white bars (cecal contents), hatched bars (large intestines), and gray bars (large intestinal contents). (B) Levels of intimin in different intestinal sites over time. Each bar represents the mean value of a subset of those samples presented in panel A (n=5–10). The limit of quantifiable intimin was 360 ng/g tissue or tissue contents. For panels B and D, each individual sample is represented by a ○. (C) Percent of different intestinal samples positive for Stx2 over time. Each bar represents the mean of 7–16 samples tested. (D) Levels of Stx2 in different intestinal sites over time. Each bar represents the mean value of a subset of those samples presented in panel C (n=5–10). The limit of quantifiable Stx2 was 6.4 ng/g tissue or tissue contents.
