Fig. 5.

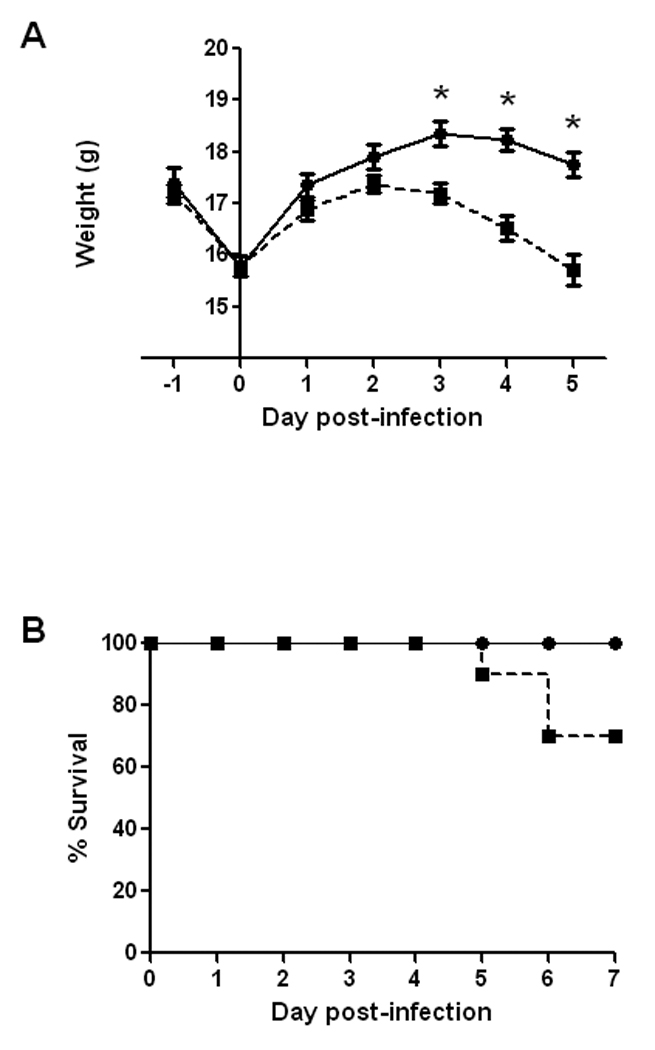
Effect of intragastric infection of BALB/c mice with ~ 109 CFU of E. coli O157:H7 strain 86-24NalR on body weight and survival. Animals were starved overnight prior to intragastric inoculation with E. coli O157:H7 on day 0. (A) Weight was monitored for the control, mock-infected animals (●) and the 86-24NalR-infected, experimental group (■). Each point on the graph represents the mean weight of 10 (or less in the case of groups with mortality) animals per group. The bars depict ± one standard error of the mean of weight. Asterisks indicate days that demonstrated a significant difference between weights of infected and control mice (p≤0.001). (B) Survival of animals infected with 86-24NalR or mock-infected. The percent of surviving animals (10 mice per group) on each day post-infection inoculated with 86-24NalR (■) or mock-infected (●).
