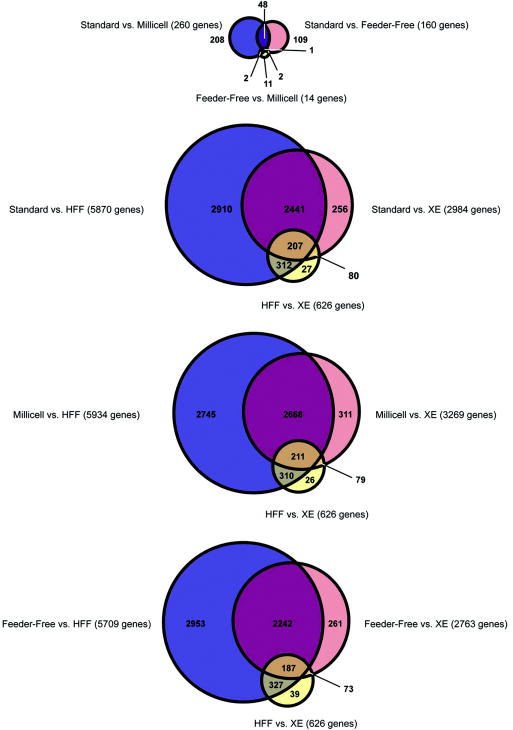
Figure 4.
Venn diagrams indicating the overlap between the sets of genes significantly differentially expressed (FDR<0.05) between pairs of samples. The top diagram shows results for the hESCs cultured in the three different conditions. The lower three diagrams show results among hESCs, HFFs and XE cells, with the data for each hESC culture conditions shown in a separate diagram. The sizes of the circles are proportional to the number of genes represented.

