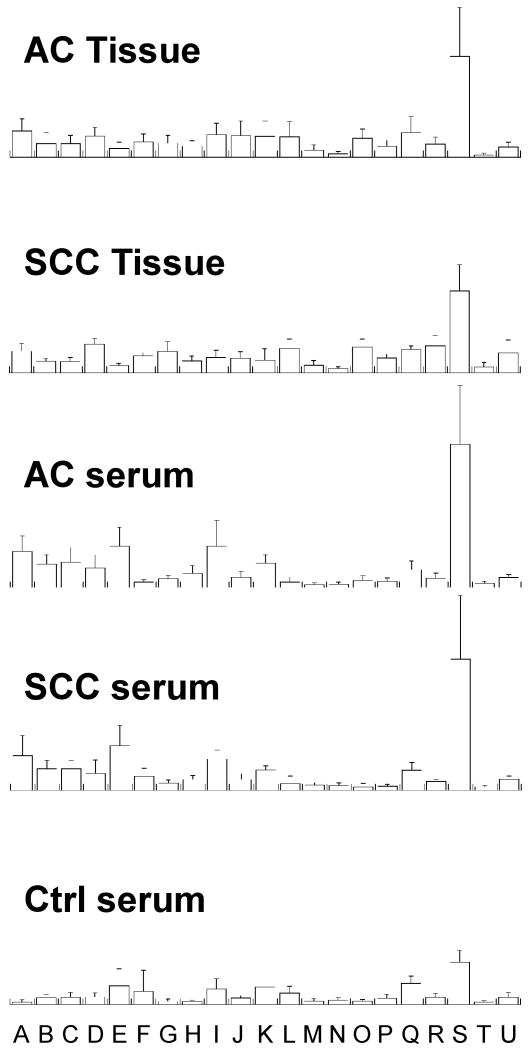
Figure 3.
The means and standard deviations of metabolic intensities normalized by the total spectral intensities measured between 0.5 and 4.5 ppm for tissue groups (SCC and AC) and serum groups (SCC, AC, and control) calculated from Supplemental Data I. The 21 regions (in ppm of chemical shifts) analyzed in the study are represented by letter A through U for: A, 4.14∼4.09; B, 3.93∼3.87; C, 3.86∼3.81; D, 3.78∼3.74; E, 3.73∼3.69; F, 3.66∼3.60; G, 3.56∼3.54; H, 3.53∼3.50; I, 3.45∼3.39; J, 3.26∼3.24; K, 3.23∼3.21; L, 3.20∼3.18; M, 3.04∼3.01; N, 2.46∼2.40; O, 2.39∼2.31; P, 2.15∼2.10; Q, 2.09∼2.03; R, 1.48∼1.45; S, 1.33∼1.31; T, 1.04∼1.02; and U, 0.96∼0.92.

