
Figure 6.
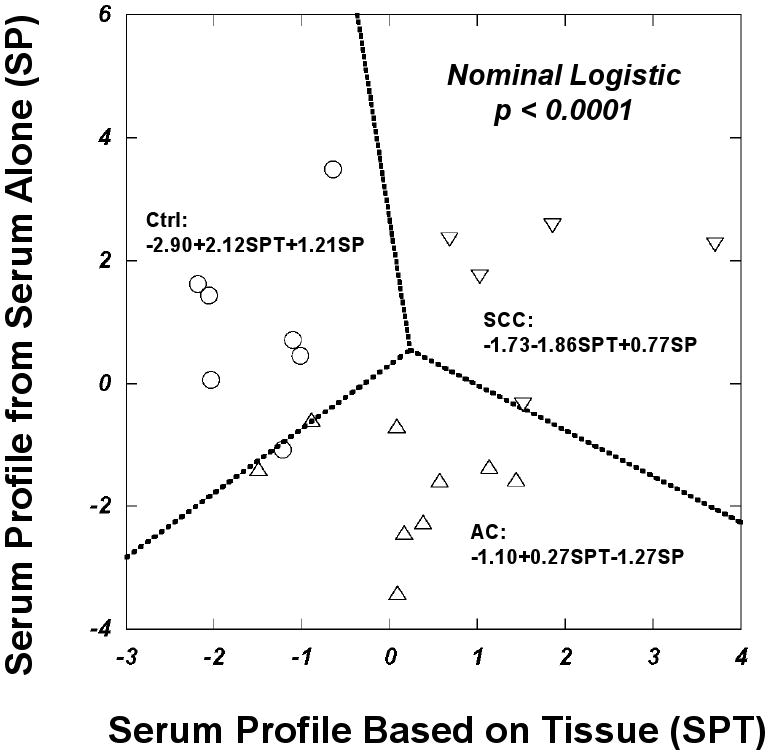
Differentiations among three tested serum groups based on nominal logistic and linear discriminant analyses of serum metabolomic profile presented as canonical scores calculated based on profile coefficients obtained from tissue analyses (SPT) and using serum spectral data independently (SP). Up-triangles represent ACs, down-triangles denote SCCs, and open-circles are control sera. Nominal logistic regression equations for each group are presented in the figure.