
Figure 1.
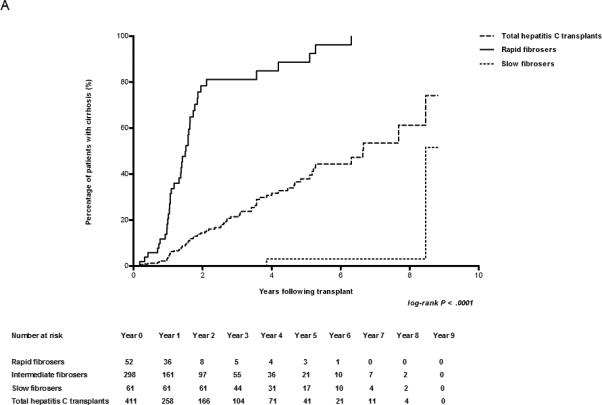
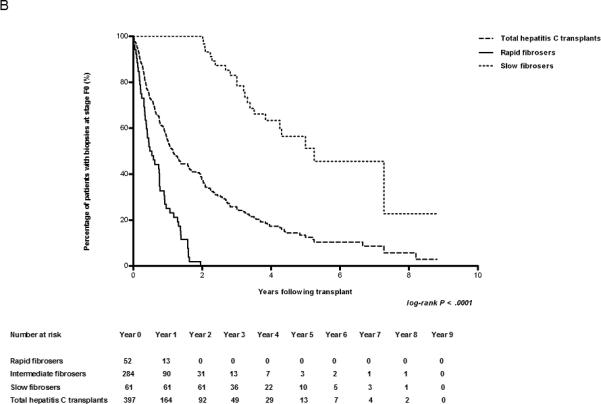
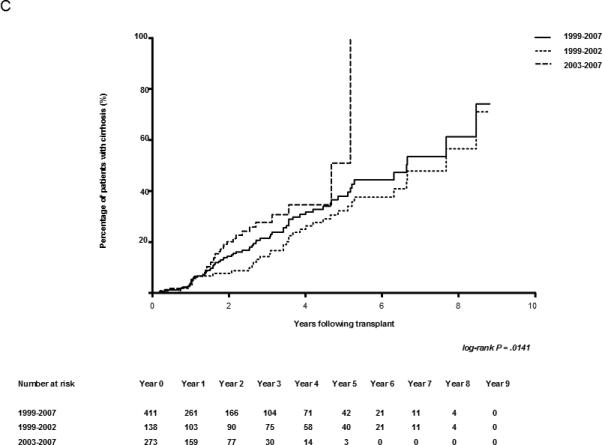
Early biopsies predict the rate of fibrosis. (A) Kaplan-Meier estimates of the development of cirrhosis (METAVIR Stage F4) in HCV-infected patients after transplant. The number of cases represented within each cohort is 440, 52, and 61 for the entire cohort, rapid fibrosers, and slow fibrosers, respectively. (B) Kaplan-Meier estimates of the development of fibrosis (METAVIR Stages F1-4) in F0 transplant livers of HCV-infected patients. Patients with baseline fibrosis on time zero biopsy were excluded. The number of cases represented within each cohort is 421, 52, and 61 for the entire cohort, rapid fibrosers, and slow fibrosers. (C) Kaplan-Meier estimates of cirrhosis progression according to transplant year in all patients undergoing liver transplantation secondary to HCV. The number of transplant cases represented is 141 for the entire cohort transplanted between 1999-2002, and 299 for the entire cohort transplanted between 2003-2007. The log-rank P value of 0.0141 reflects the comparison in cirrhosis progression among groups from 1999-2002 and 2003-2007. The total cohort includes rapid, slow, and intermediate fibrosers. The number at risk for each year is shown below the graph.