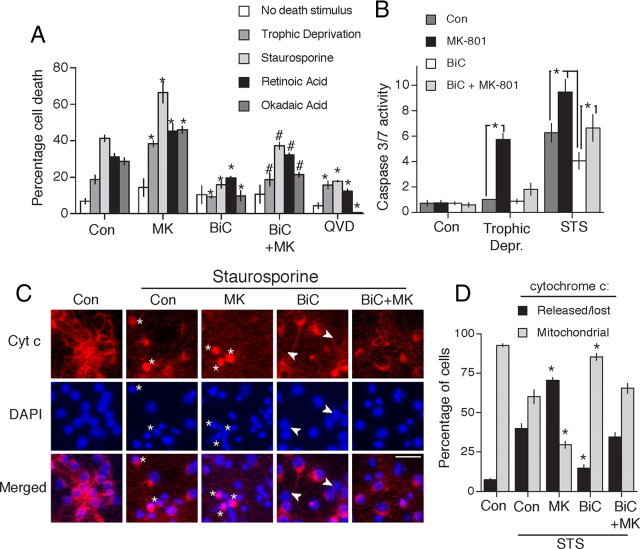
Figure 1.
Neuroprotection afforded by synaptic activity. A, Synaptic activity protects neurons against inducers of apoptosis. Mouse cortical neurons were treated in the presence or absence of the indicated compounds [BiC/4-AP: bicuculline (50 μm) plus 4-aminopyridine (250 μm) is labeled as “BiC” in figures]; MK-801 used at 10 μm here and throughout. These drugs were added 16 h before the addition of inducers of apoptosis (staurosporine, 100 nm; retinoic acid, 5 μm; okadaic acid, 2 nm). QVD-Oph was used at 50 μm and added 1 h before the addition of inducers of apoptosis. After a further 24 h, the neurons were fixed and levels of cell death calculated. In the case of trophic deprivation, neurons were subjected to 72 h in trophically deprived medium in the presence or absence of BiC, MK-801, or QVD-Oph. *p < 0.05 (compared to levels of death in the equivalent control condition); #p < 0.05 compared to levels of death in the BiC/4-AP-stimulated neurons [two-way ANOVA followed by Fisher's LSD test (n = 4)]. “No death stimulus” refers to neurons placed in standard transfection medium containing the insulin-transferrin-selenite supplement (trophic medium). B, Caspase-3/7 activation by apoptotic stimuli is suppressed by synaptic NMDAR activity. For the trophic deprivation model, neurons were treated with the indicated drugs for 48 h in trophically deprived medium. For the staurosporine (STS) model, neurons were treated with the indicated drugs for 16 h before treatment with staurosporine (100 nm) for a further 16 h. Control condition is trophic medium as described in A. Caspase-3/7 activity was measured and normalized to protein levels ascertained by BCA assay. *p < 0.05, one-way ANOVA followed by Fisher's LSD test here and elsewhere unless otherwise stated (n = 4). C, Synaptic NMDAR activity inhibits staurosporine-induced cytochrome c (Cyt c) release. Neurons were treated as in A. Cytochrome c immunofluorescent staining was performed 16 h after exposure to staurosporine. Asterisks highlight cells exhibiting diffuse staining throughout the neuron, a transient state that precedes loss of staining and apoptosis. The white arrows highlight neurons where cytochrome c has been lost, but nuclear chromatin fragmentation has not taken place, indicative of protection downstream of cytochrome c release. Pictures are representative of four independent experiments. Scale bar, 40 μm. D, Quantification of data shown in C. For each condition, ∼1500 cells were analyzed across four independent experiments. *p < 0.05 compared to control condition (STS treated).

