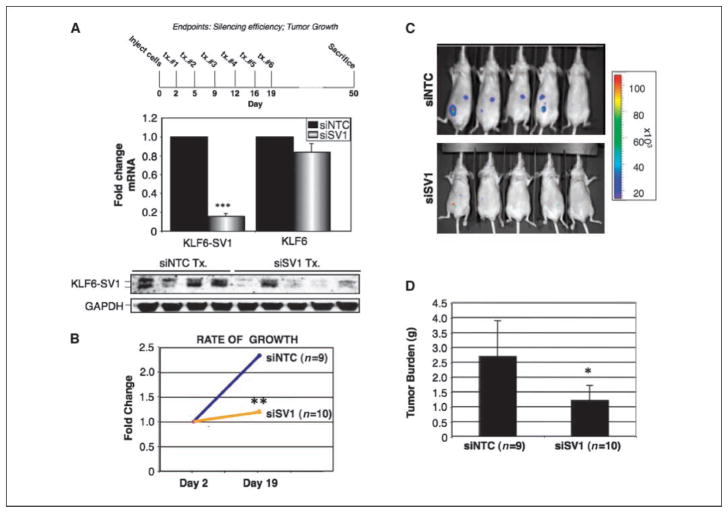
Figure 1.
In vivo antitumor effects of KLF6-SV1 inhibition. A, top, treatment regimen; middle, quantitative real-time PCR for KLF6-SV1 and KLF6 expression levels in i.p. tumors; bottom, Western blot analysis of KLF6-SV1 protein levels in i.p. tumors after treatment with siNTC or siSV1. B, rate of growth of tumors treated with siNTC or siSV1, measured by in vivo molecular imaging. C, total bioluminescent signal from the abdominal region of treated mice at day 19 after the final dose of siSV1 or siNTC. D, total tumor mass. *, P < 0.05; **, P < 0.005; ***, P < 0.0005.

