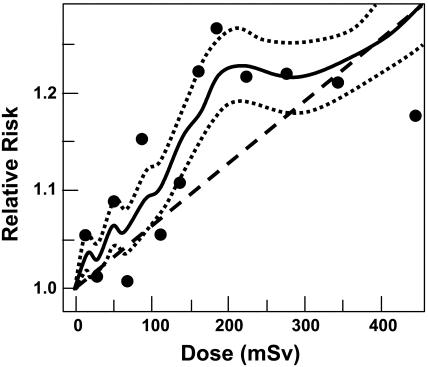
Fig. 4.
Estimated risks (relative to an unexposed individual) of solid cancer in atomic bomb survivors exposed to low radiation doses (12). Data points are placed at the mean of each dose category. The solid curve represents a weighted moving average of the points shown (dotted curves: ±1 SE), and the dashed straight line is a linear risk estimate computed from all the data in the dose range from 0 to 2,000 mSv. Age-specific cancer rates from 1958 to 1994 are used, averaged over follow-up and gender.

