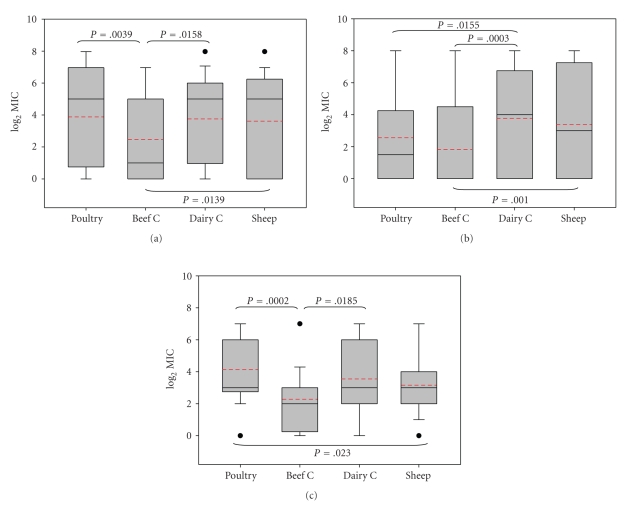
Figure 1.
Box Plots representing log2-transformed MIC values distribution among host species for (a) Quinolones, (b) Tetracyclines, (c) β-lactams. To standardise MIC values for all antimicrobials, MICs were divided by the lowest value tested for each antimicrobial before log transformation. The boundary of the box closest to zero indicates the 25th percentile; the continuous line within the box marks the median; a dashed line marks the mean and the boundary of the box farthest from zero indicates the 75th percentile. Error bars above and below the box indicate the 90th and 10th percentiles. Outlying points are represented as closed dots. Significant differences (P < .05) are indicated with their corresponding P values.

