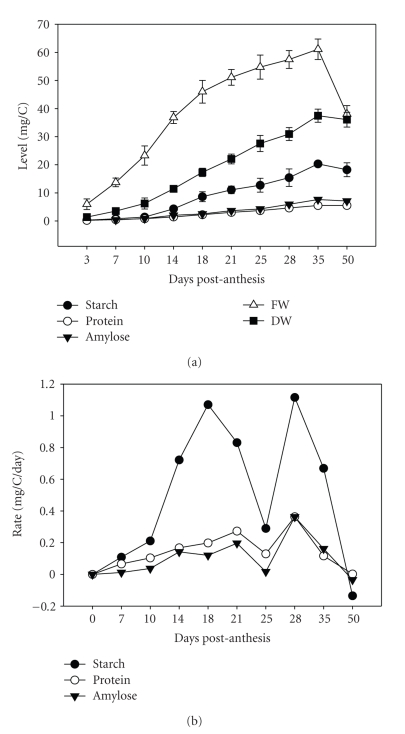
Figure 2.
Amount and rate of storage product accumulation in the developing wheat grain. For both starch and protein assays, three determinations were made per biological sample, and 2–5 samples were used per time-point. The amylose data is the mean of the measurements of 3-4 biological replicates per time-point. (a) Level of starch, protein, amylose, fresh weight (FW) and dry weight (DW) per caryopis (mg/C) where C denotes caryopsis. (b) Rate of starch, protein and amylose accumulation (mg/C/day). Rate of accumulation was determined for each time interval.

