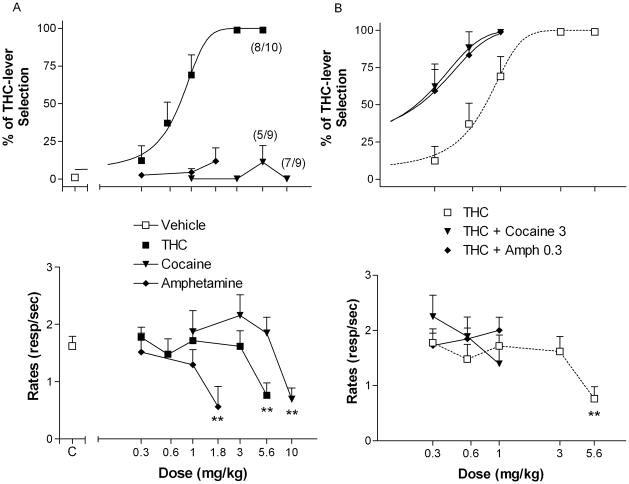
Figure 1.
Effects of cocaine and amphetamine in rats trained to discriminate 3 mg/kg of THC from THC vehicle (A) and effects of selected doses of cocaine (3 mg/kg) and amphetamine (0.3 mg/kg) on the dose-response curve for THC discrimination (B). Ordinates: overall percentage of responses on the lever associated with THC administration (upper panels) and overall rate of lever pressing expressed as responses per seconds (lower panels) averaged over the entire session. Abscissae: dose in mg/kg (log scale). Results represent means±SEM from 9–10 rats. C = control value for THC vehicle alone. Repeated measures ANOVA followed by post-hoc Dunnet’s test: **: p<0.01 compared to vehicle. Numbers in parenthesis at higher doses indicate the number of rats that completed at least one fixed ratio during the session over the total number of rats in which the dose was tested. Dose-response curve data for THC are the same for A and B.

