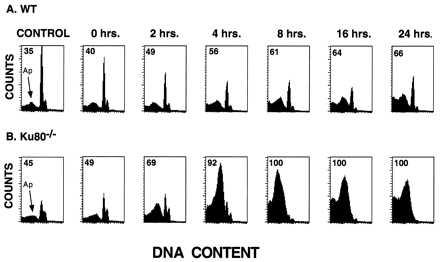
Figure 4.

Radiation response of Ku80−/− pre-B cells. Representative DNA content histograms of (A) wild-type and (B) Ku80−/− pre-B cell lines before and after treatment with 200 cGy of γ-irradiation. Samples were processed for DNA content analysis by flow cytometry at different times postirradiation. γ-irradiation increased the appearance of cells with fractional DNA content, which coincided with a loss of cells in the cycling population. The sub-G0 peak corresponding to apoptotic cells is indicated by an arrow, and the proportion of apoptotic cells is quantified.
