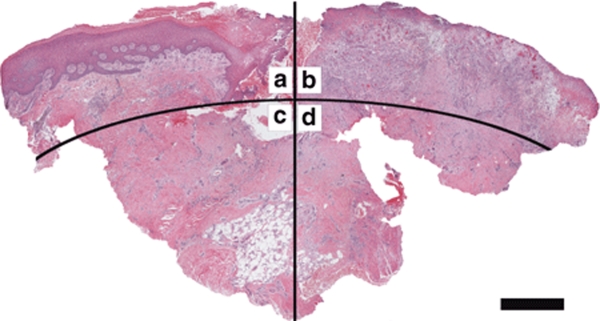
Figure 2.
Representative image of a wound biopsy after hematoxylin and eosin staining showing the regions used for cell quantitation and vessel density analysis. (a) Superficial subepithelial region, (b) superficial ulcer region, (c) subepithelial dermal (or deep) region, and (d) ulcer deep region. Bar = 1 mm.

