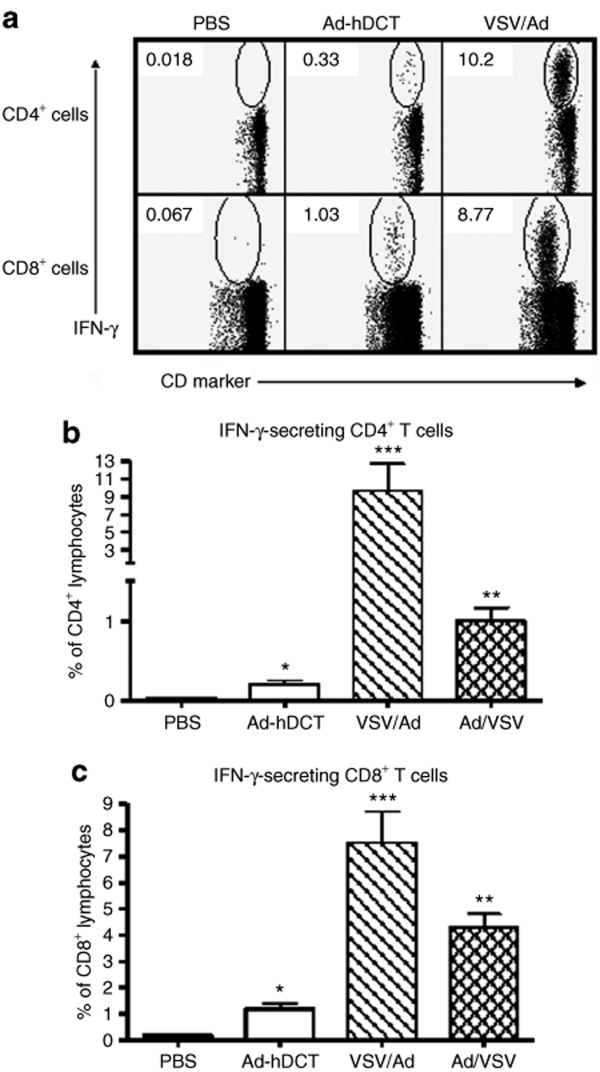
Figure 4.
Sequential immunization with VSV-hDCT and Ad-hDCT generates a strong prime–boost effect. C57BL/6 mice (n = 5/group) were treated as follows: (i) PBS on days 0 and 14 (PBS), (ii) PBS on day 0 and Ad-hDCT on day 14 (Ad-hDCT), (iii) VSV-hDCT on day 0 and Ad-hDCT on day 14 (VSV/Ad), and (iv) Ad-hDCT on day 0 and VSV-hDCT on day 14 (Ad/VSV). Blood sampled on day 21 was used to quantify T-cell responses by flow cytometry after in vitro peptide restimulation and intracellular cytokine staining. (a) Representative dot plots showing DCT-specific CD4+ (top row) and CD8+ (bottom row) T-cell responses in the PBS controls (first column), mice immunized with Ad-hDCT only (second column), and mice immunized with VSV-hDCT and subsequently boosted with Ad-hDCT (third column). A summary of CD4+ and CD8+ T-cell responses to DCT is shown in (b) and (c), respectively. Data shown are means plus standard error bars. Asterisks denote significant differences compared to PBS control (P ≤ 0.05, by one-way analysis of variance). Ad, adenovirus; hDCT, human dopachrome tautomerase; IFN-γ, interferon-γ; PBS, phosphate-buffered saline; VSV, vesicular stomatitis virus.

