Figure 6.
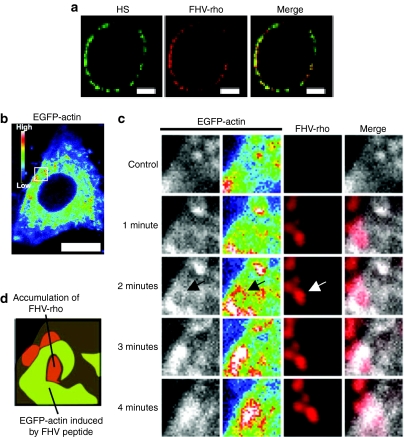
Massive accumulation of the FHV peptide on cell surface leads actin rearrangement. (a) Confocal microscopic observation of CHO-K1 cells treated with anti-HS antibody and rhodamine-labeled FHV peptide (FHV-rho) (1 µmol/l) at 4 °C (green, HS; red, FHV peptide). Bar = 5 µm. (b,c) Confocal microscopic observations of EGFP-actin expressed CHO-K1 cells treated with FHV-rho (1 µmol/l) at 37 °C under 5% CO2. Nontreatment (control) (b,c), and ~4 minutes treatment (c) with the peptide. Intensity of EGFP-actin is represented by dark blue (low) and white (high). Bar = 10 µm. Arrow shows the high intensity of EGFP-actin signals around the massive adsorption of FHV-rho. (d) Schematic illustration of 2 minutes treatment in c. Green, high levels of EGFP-actin; red, accumulation of FHV-rho. EGFP, enhanced green fluorescent protein; FHV, flock house virus; HS, heparan sulfate.

