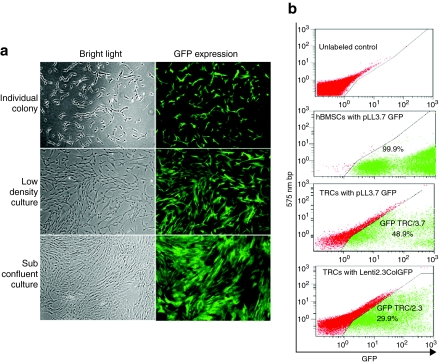
Figure 1.
Transduction efficiency of hBMSCs and TRCs with a CMVGFP lentivirus. (a) GFP expression in transduced hBMSCs visualized by fluorescent microscopy. The left panel is a bright field image and right panel is fluorescence to visualize GFP+ cells. Original magnification: ×40. (b) Quantitative analysis of transduction efficiency of hBMSCs and TRC with pLL3.7 or Lenti2.3ColGFP vector by flow cytometry as shown in a two parameter plot. GFP, green fluorescent protein; hBMSCs, human bone marrow stromal cells; TRCs, tissue repair cells.

