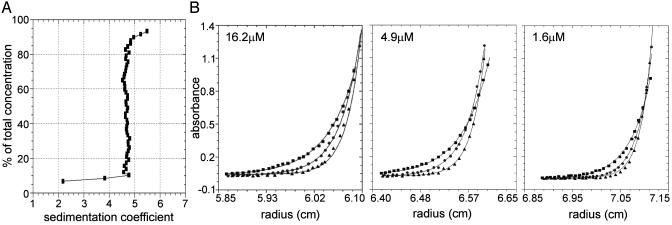
Fig. 1.
Analysis of L1 ORF1p by analytical ultracentrifugation. (A) Van Holde–Weischet integral distribution plot (boundary fraction versus S20,w) derived from sedimentation velocity analysis. The S value at 50% of the boundary corresponds to the sedimentation coefficient, S20,w. The initial loading concentration of ORF1p was 16.2 μM. Data were collected at 280 nm and at a rotor speed of 50,000 rpm. (B) Sedimentation equilibrium analysis of ORF-1, plotted as absorbance versus radius. Shown are data from the three initial loading concentrations: 16.2 μM (scanned at 280 nm), 4.9 μM (scanned at 237 nm), and 1.6 μM (scanned at 230 nm). Symbols represent ORF-1 absorbance at each rotor speed (squares, 14,000 rpm; circles, 17,000 rpm; triangles, 20,000 rpm). Solid lines represent the best-fit model (trimer) from simultaneous analysis of all nine data sets. Square root of the variance for the analysis was 0.011 OD units. For clarity, only every fifth data point is shown.

