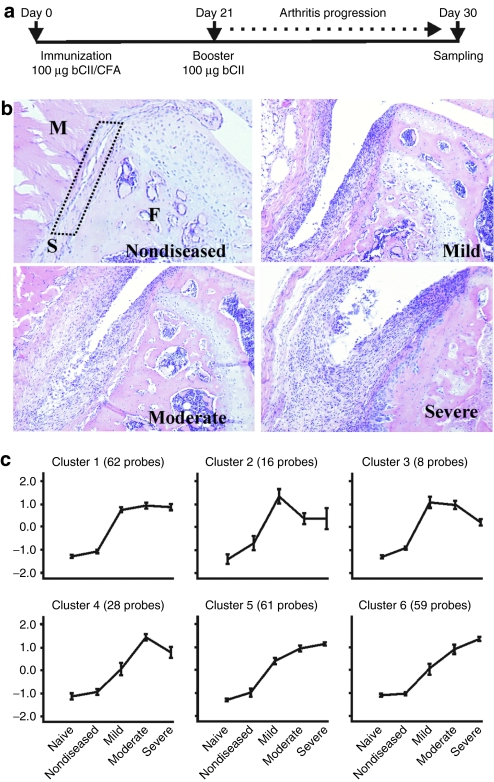
Figure 1.
Cluster analysis of gene expression profiles from collagen-induced arthritis. (a) Schematic overview of the collagen-induced arthritis model. DBA/1J mice were immunized at day 0 by intradermal injection of bovine collagen type II (bCII). Immunized mice received an intraperitoneal booster injection of bCII at day 21 that triggers arthritis onset. After 10 days of arthritis progression, knee joints were macroscopically scored and divided in the four indicated severity stages. (b) Representative hematoxylin and eosin–stained tissue sections of knee joints from the four advancing severity stages are shown. M, muscle; S, synovium (dotted rectangle); F, femur. (c) Mean expression profiles of the eight clusters obtained with k-means clustering in EXPANDER 4.1. The y axis represents standardized expression levels. Error bars represent the ± 1 SD of the members of each cluster about the mean of the particular severity stage.

