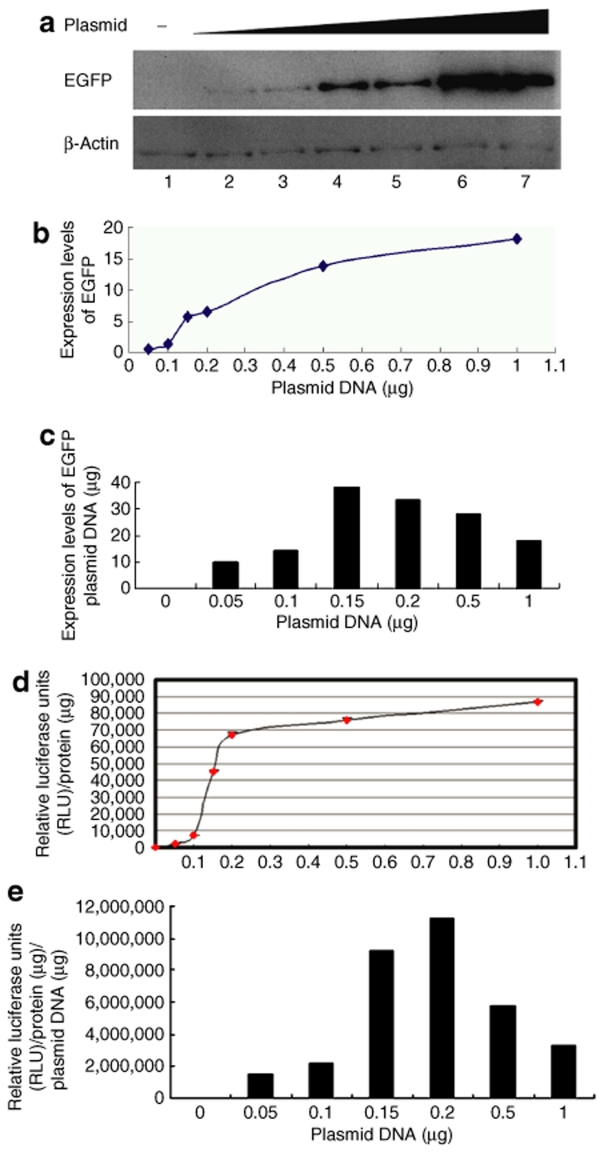
Figure 4.
Determination of transfection efficiency by microporation of different concentrations of reporter DNA into human adipose tissue–derived stem cells (hADSCs). (a) hADSCs were transfected without or with pCMV-EGFP-N1 at different doses (0.05, 0.1, 0.15, 0.2, 0.5, or 1 µg) as described in Materials and Methods, and the expression level of enhanced green fluorescent protein (EGFP) was determined by western blot analysis with anti-EGFP antibody. (b) The graph shows densitometric analysis of EGFP expression, normalized to β-actin expression. (c) Calculation of relative EGFP expression per dose of plasmid DNA in hADSCs. (d) hADSCs were transfected with pRL-TK at different doses (0.05, 0.1, 0.15, 0.2, 0.5, or 1 µg), and luminescence was measured with TopCount NXTTM. Luciferase activities were normalized to protein content and expressed in relative luciferase units (RLUs) as the mean ± SD of three independent samples. (e) Calculation of the relative luciferase activity per dose of reporter plasmid DNA following microporation into hADSCs.

