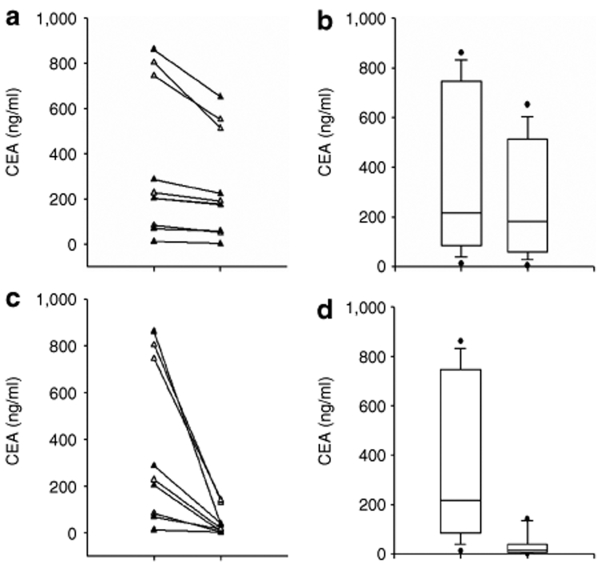
Figure 4.
Changes in carcinoembryonic antigen (CEA) levels. (a) Maximum drop in CEA before chemotherapy in the first 28 days after NV1020 administration for each individual subject. Drops varied between 13 and 74% (median 24%). (b) Box plots of these data. P = 0.02 by paired t-test. (c) Maximum drop in CEA after chemotherapy. Drops varied between 50 and 98% (median 96%). (d) Box plots of these data. P = 0.008 by paired t-test.

