Figure 2.
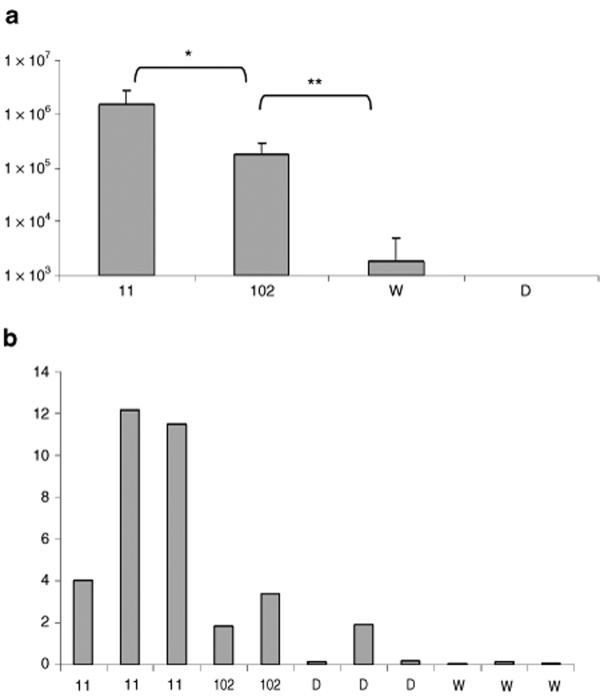
Quantitative PCR. (a) Quantization of AAV8-hVLCAD genomes in total genomic DNA in liver tissue from treated mice at 11 (N = 3) and 102 (N = 2) days as compared to control wild-type (W, N = 3) and knockout (D, N = 3) mice. The y-axis represents average AAV genomes detected per microgram total genomic DNA. Error bars represent one standard deviation. Single asterisk indicates P value <0.05; double asterisk indicates P < 0.0001. (b) RT-qPCR of individual mice (×100, y-axis) at 11 and 102 days in treated mice and controls. The y-axis represents the relative percentage of AAV8 genomes detected per GADPH genome (×100). Additional control samples from this study omitting reverse transcriptase were negative and not shown.

