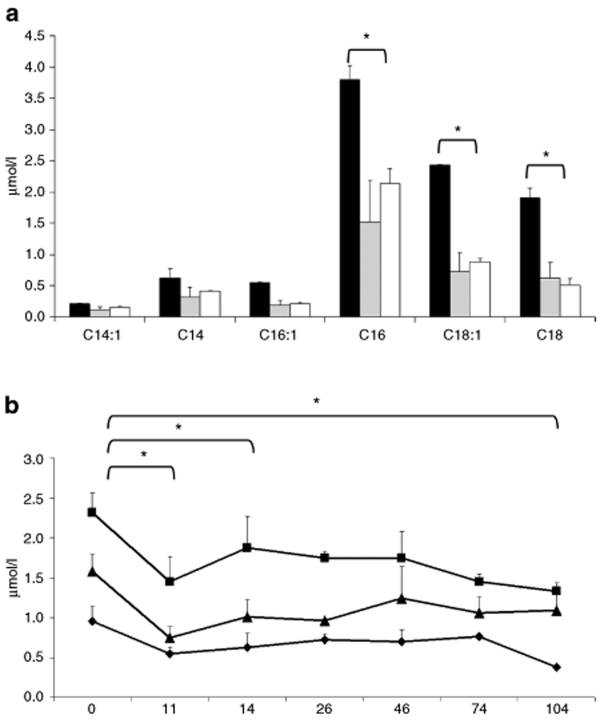
Figure 4.
Acylcarnitine analysis. (a) Short-term study following VLCAD-deficient mice injected with AAV8-hVLCAD (N = 2, gray column) with blood collected at 14 days postinjection following a 24-hour fast compared with control wild-type (N = 3, white) and deficient (N = 2, black) mice. Asterisks indicate P value <0.05 between untreated mice and injected mice. There was no significant difference between injected and wild-type mice. (b) Long-term study of AAV8-hVLCAD-injected VLCAD-deficient mice were with blood collected from early and late treatment groups (N = 7) at days 0, 11, and 14. Days 26 through 104 represent only the late treatment group (N = 3). C16- (square), C18:1- (triangle), and C18- (diamond) acylcarnitine levels. Measurements indicate average of all injected mice at that time point. Error bars represent one standard deviation. Asterisks indicate P value <0.05 for comparisons between 0 and 11, 14, or 104 days for C16-acylcarnitine.

