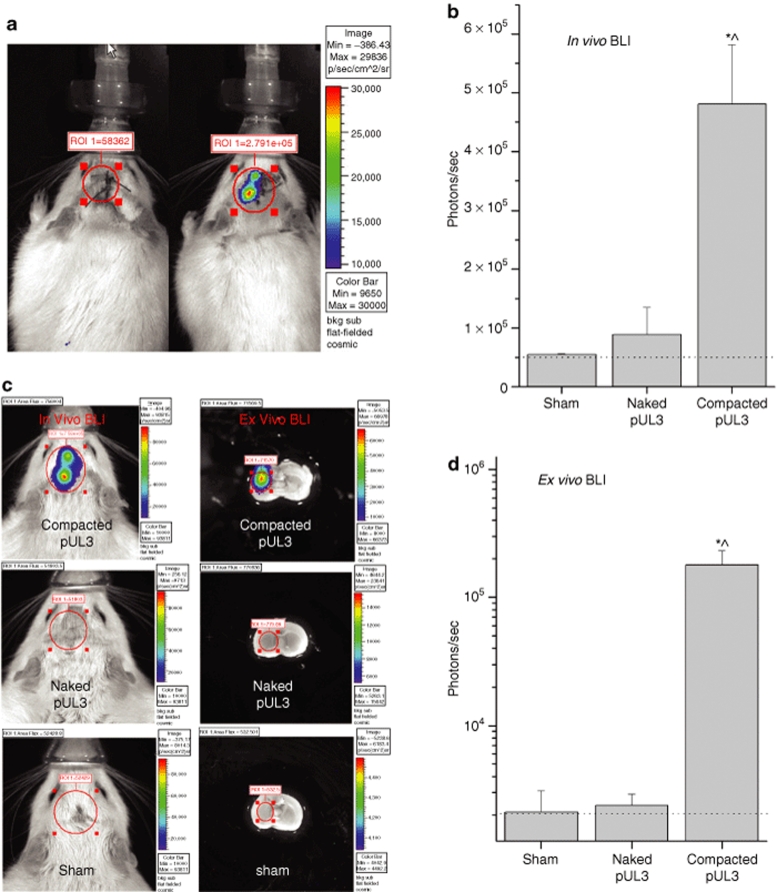
Figure 5.
In vivo and ex vivo bioluminescent imaging 1–11 weeks following an intracerebral injection of naked or compacted pUL3 plasmid. Rats were injected with luciferin (150 mg/kg, intraperitoneal) 10 minutes prior to image acquisition and maintained under 2.0% isofluorane anesthesia while in the IVIS 200 bioluminescent imager. The pseudocolor image superimposed on a gray-scale image of the rat body or coronal brain section represents photons emitted by live cells following the luciferin/luciferase light reaction that occurs within transfected brain cells and detected by the IVIS 200 imaging system; color scale bar on the right shows the photon counts (photon/s/cm2/sr). Red circle indicates region of interest (ROI) for bioluminescent imaging (BLI) analysis; ROI is centered over the left striatal region and values are reported as photons/s. (a) In vivo BLI 1 week following an intracerebral injection of naked or compacted pUL3. Animal on the left received naked pUL3 (4.2 µg/µl, 4.0 µl) and animal on the right received compacted pUL3 (3.9 µg/µl, 4.0 µl) into the left striatum; injections were targeted for a region 5–6 mm below the surface of the brain. (b) Graph summarizing in vivo BLI data for animals receiving intrastriatal injections of naked pUL3, compacted pUL3, or sham injections at 8–11 weeks postinjection. As shown in a, an approximate 2.5 cm2 circular ROI was centered over the striatal region and photon emissions were quantified within the ROI. Bars represent the average photon emission (photons/s + SEM) for compacted pUL3 (n = 4), naked pUL3 (n = 4), or sham (n = 4). *P < 0.05, compacted pUL3 versus naked pUL3; ^P < 0.05, compacted pUL3 versus sham. (c) In vivo and ex vivo bioluminescent imaging of live animals or postmortem brain 11 weeks following an intrastriatal injection of compacted pUL3 (top row), naked pUL3 (middle row), or sham injection (bottom row). BLI images of the animals receiving compacted or naked pUL3 were obtained from the same two animals shown in a but 10 weeks later. After the initial in vivo BLI session, the animals were euthanized, the brains removed, placed into an ice-cold brain matrix (ASI Instruments, Warren, MI) and cut into 3-mm sections so that the injection sites lie just below the surface facing the camera. While the coronal section for the brain treated with naked pUL3 (middle) is slightly more anterior than that shown for the brain treated with compacted pUL3 (top), the injection site was still fully contained within the sample. It is also important to note that imaging of the coronal sections was completed within 20 minutes following the injection of luciferin, and it is our experience that luciferase remains active 30 minutes postinjection. (d) Graph summarizing ex vivo BLI data for animals receiving intrastriatal injections of naked pUL3, compacted pUL3 or sham injections at 8–11 weeks postinjection. As shown in the ex vivo BLI images (c), an approximate 0.15 cm2 circular ROI was centered over the striatal region of the coronal brain section and photon emissions were quantified within the ROI. Bars represent the average photon emission (+SEM) for compacted pUL3 (n = 5), naked pUL3 (n = 5), or sham (n = 5). Scale for y-axis is log10. Dotted lines in graphs (b,d) indicate background levels of photon emissions. *P < 0.001, compacted pUL3 versus naked pUL3; ^P < 0.001, compacted pUL3 versus sham.

