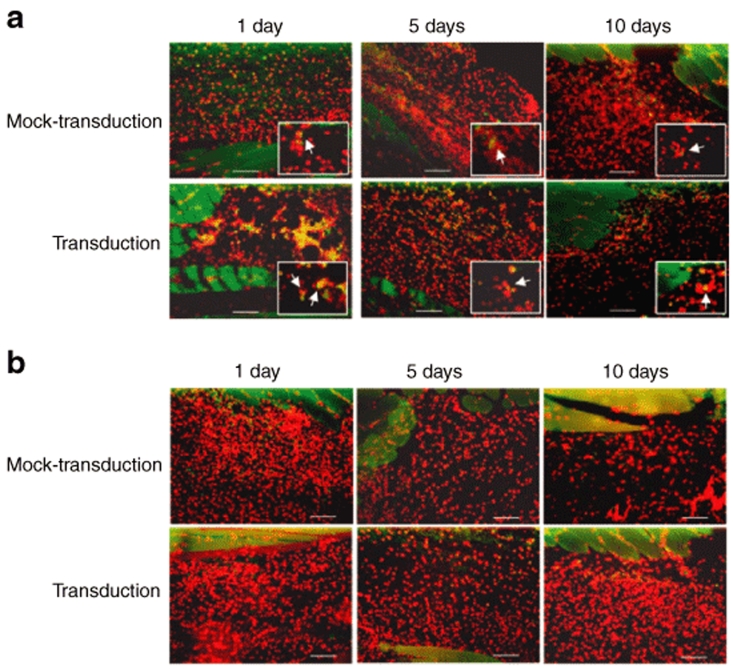
Figure 6.
Infiltration of macrophages and CD8+ T cells into the transplantation site. (a) Immunohistochemical staining for macrophages. (b) Immunohistochemical staining for CD8+ T cells. The immune cells were visualized with Alexa 488-conjugated secondary antibody and appeared green on the cell membrane. All nucleated cells were stained by 4′,6-diamidino-2-phenylindole and appeared red. n = 3 for each time point. The original magnifications were ×200 (scale bars =100 µm). The enlarged images (magnification, ×1,000) are shown in the insets.

