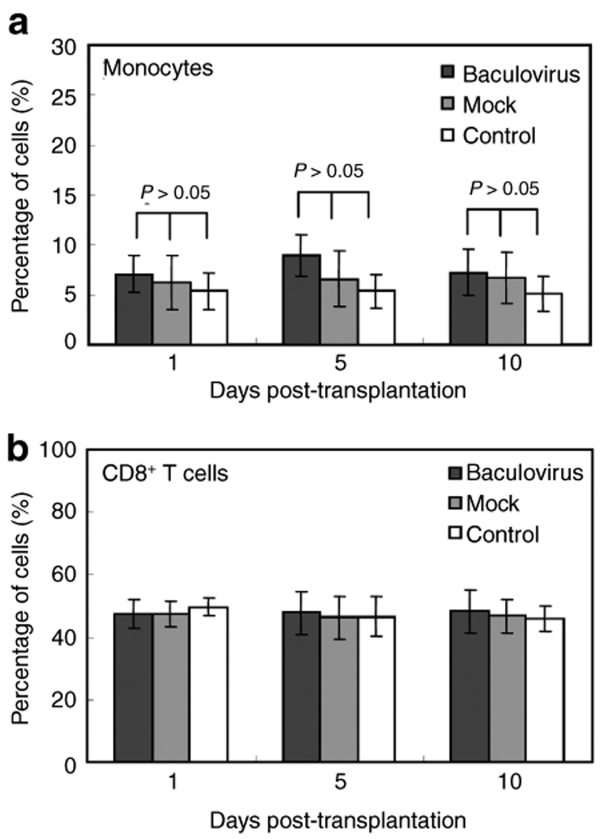
Figure 7.
Quantification of monocytes and CD8+ T cells in the PBMC population. The percentages of (a) monocytes and (b) CD8+ T cells in the PBMC population were measured by immunofluorescence labeling/flow cytometry. The PBMC collected from healthy animals without transplantation serve as the control. n = 3 for each time point. Statistical analysis was performed by analysis of variance in conjunction with post hoc tests. PBMC, peripheral blood mononuclear cells.

