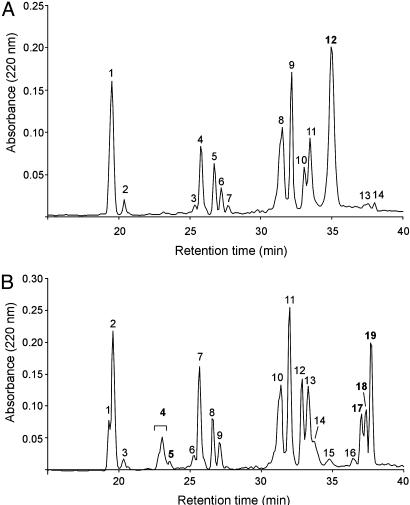
Fig. 5.
Tryptic peptide map of EC-SOD monomers. EC-SOD collected in fractions 1.1 and 1.2 (Fig. 2) were digested with trypsin. The generated peptides were separated by reversed-phase HPLC, and the 220-nm traces of aEC-SOD (fraction 1.1) (A) and iEC-SOD (fraction 1.2) (B) are shown. All collected peptides were analyzed by Edman degradation and MALDI-MS. The represented differences between the traces are numbered in bold and are presented in Table 1.

