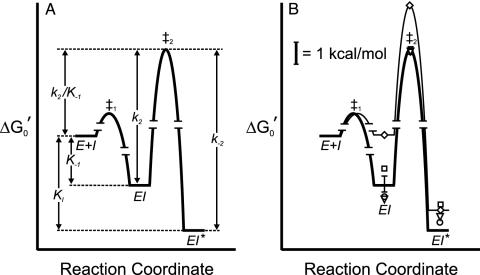
Fig. 2.
Free-energy profile for the interaction of INH-NAD with InhA.  was calculated for the EI and EI* states by using K–1 and Ki and applying a standard state of 1 μM. The free energy of the transition state for the conversion of EI to EI* (‡2) is determined from k2.(A) Free-energy profile for WT InhA. (B) Free-energy profiles for WT enzyme (heavy line) and M161V (light line, ⋄), and data points for I21V (▿), I47T (○), and S94A (□).

