
Fig. 1.
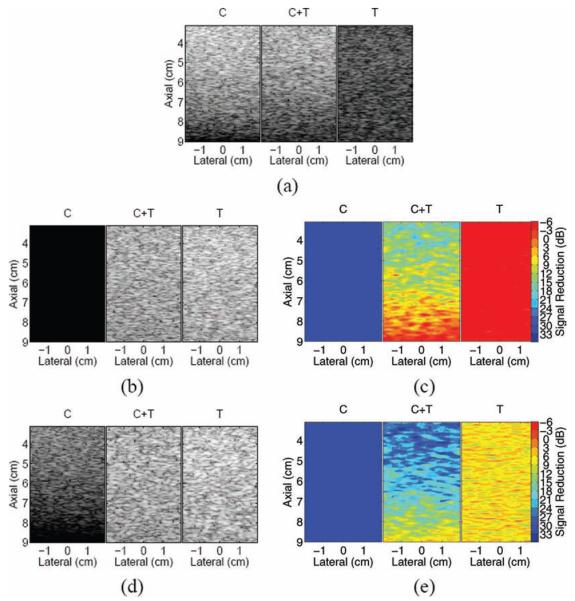
(a) Simulated phantom images showing clutter noise (C), clutter noise mixed with homogeneous tissue (C+T), and homogeneous tissue (T); (b) finite impulse response (FIR)–filtered images; (c) corresponding maps of magnitude reductions in FIR-filtered images; (d) blind source separation (BSS)–filtered images; and (e) corresponding maps of magnitude reductions in BSS-filtered images.